Navigating to the Data
To begin:
You need to select a state (not the United States) to see the choices for Metro Area or County.
Interacting with the Data
Roll-over the graphs to easily view data values for each year. Select graph points or bars and navigate to more detail.
Select each chart's legend to add or remove lines on the graph. The data on the axis can dynamically adjust based on the selected data.
Reading the Charts
Establishment is defined as an economic unit that produces goods and/or services at a single physical location. All businesses are tracked including for-profit (privately owned and publicly traded), non-profit, government, sole proprietors, and proprietors.
Jobs are defined as all persons currently working at an establishment including full-time, part-time, and temporary workers. This includes proprietorships and sole proprietors (self-employed).
Change is the percentage of total annual change in Establishments and Jobs.
New Establishments an establishment that is new (uniquely idnetified) to the YE Time Series database.
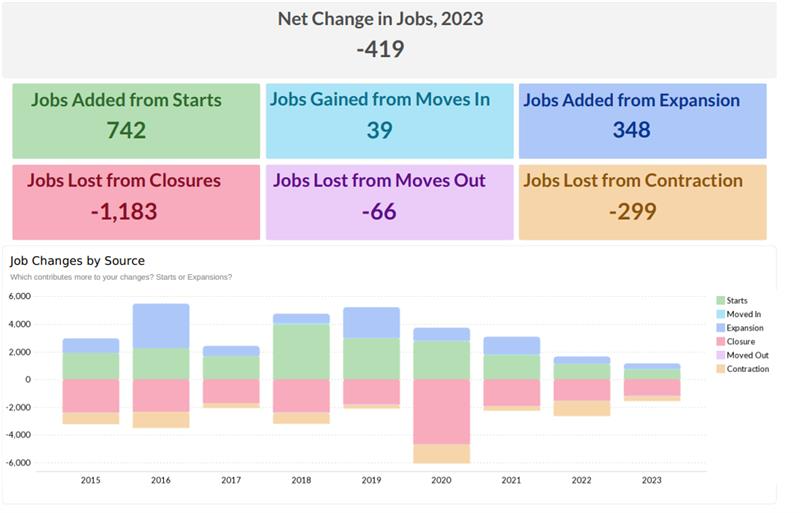
Gain & Loss
Gain – gross increase in establishments, jobs, starts, expansions (jobs), and moves (into region).
Loss - gross decrease in establishments, jobs, closings, contractions (jobs), and moves (out of region).
Net New - the subtraction of gross loss from gross gain.
YE Industries
YE Industries are geographic concentrations of industries (all 6- digit NAICS) related by knowledge, skills, inputs, demand, and/or measures of inter-industry linkages grouped into 3 segments; Local, External, and Non Trade/Healthcare. More Info»
Ranking
YE ranks Jobs Change, Establishment Change, and New Establishments by:
States - ranked against 50 states and D.C. with U.S. included for comparison (average).
Metro Areas - ranked against 382 metro areas in the U.S.
Counties - ranked against all the counties in the state you are viewing.
Want Something Else?»

Explore  Interactive Dashboards!
Perfect for economic developers, researchers, policymakers, and others to:
DISCOVER
- 10 year establishment & job trends
- Dynamics of establishment & job change
- Industries, establishment size, owner demographics
- Data updated twice each year
- New reports and features added every 6 weeks
- Communities: group of zip codes, individual county: $750
- Regions: Group of counties, most metropolitan areas: $1,500
- States, largest metros: $9,500
- National (entire U.S.) Contact Us»
Pricing
EXPLORE
- Compare your region to 3 similar geographies
- Explore changes by industry and establishment size
- Select any period from 2014-2023
- Communities: group of zip codes, individual county: $1,250
- Regions: Group of counties, most metropolitan areas: $2,500
- States, largest metros: $13,500
- Custom Regions Contact Us»